Shiller - The US stock market looks like it did before most of the previous 13 bear markets23/9/2017
by Robert Shiller Project Syndicate September 22, 2017 The U.S. stock market today is characterized by a seemingly unusual combination of very high valuations, following a period of strong earnings growth, and very low volatility. What do these ostensibly conflicting messages imply about the likelihood that the United States is headed toward a bear market in stocks SPX, -0.04% ? To answer that question, we must look to past bear markets. And that requires us to define precisely what a bear market entails. The media nowadays delineate a “classic” or “traditional” bear market as a 20% decline in stock prices. That definition does not appear in any media outlet before the 1990s, and there has been no indication of who established it. It may be rooted in the experience of Oct. 19, 1987, when the stock market dropped by just over 20% in a single day. Attempts to tie the term to the “Black Monday” story may have resulted in the 20% definition, which journalists and editors probably simply copied from one another. Origin of the ‘20%’ figure In any case, that 20% figure is now widely accepted as an indicator of a bear market. Where there seems to be less overt consensus is on the time period for that decline. Indeed, those past newspaper reports often didn’t mention any time period at all in their definitions of a bear market. Journalists writing on the subject apparently did not think it necessary to be precise. In assessing America’s past experience with bear markets, I used that traditional 20% figure, and added my own timing rubric. The peak before a bear market, per my definition, was the most recent 12-month high, and there should be some month in the subsequent year that is 20% lower. Whenever there was a contiguous sequence of peak months, I took the last one. Referring to my compilation of monthly S&P Composite and related data, I found that there have been just 13 bear markets in the U.S. since 1871. The peak months before the bear markets occurred in 1892, 1895, 1902, 1906, 1916, 1929, 1934, 1937, 1946, 1961, 1987, 2000 and 2007. A couple of notorious stock-market collapses — in 1968-70 and in 1973-74 — are not on the list, because they were more protracted and gradual. CAPE ratio Once the past bear markets were identified, it was time to assess stock valuations prior to them, using an indicator that my Harvard colleague John Y. Campbell and I developed in 1988 to predict long-term stock-market returns. The cyclically adjusted price-to-earnings (CAPE) ratio is found by dividing the real (inflation-adjusted) stock index by the average of 10 years of earnings, with higher-than-average ratios implying lower-than-average returns. Our research showed that the CAPE ratio is somewhat effective at predicting real returns over a 10-year period, though we did not report how well that ratio predicts bear markets 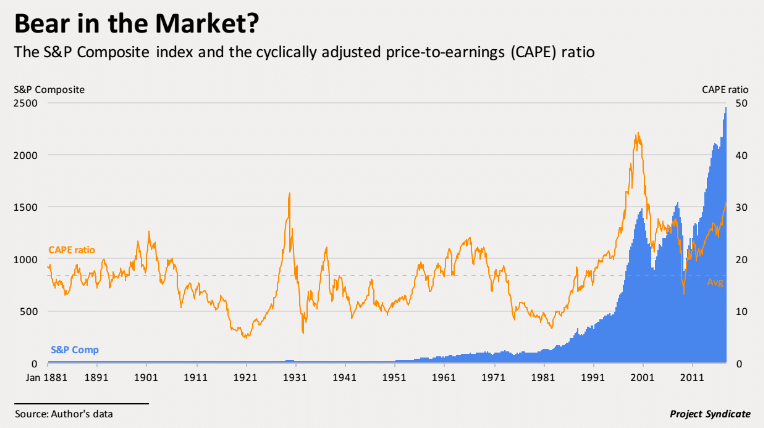 This month, the CAPE ratio in the U.S. is just above 30. That is a high ratio. Indeed, between 1881 and today, the average CAPE ratio has stood at just 16.8. Moreover, it has exceeded 30 only twice during that period: in 1929 and in 1997-2002.
But that does not mean that high CAPE ratios aren’t associated with bear markets. On the contrary, in the peak months before past bear markets, the average CAPE ratio was higher than average, at 22.1, suggesting that the CAPE does tend to rise before a bear market. Moreover, the three times when there was a bear market with a below-average CAPE ratio were after 1916 (during World War I), 1934 (during the Great Depression) and 1946 (during the post-World War II recession). A high CAPE ratio thus implies potential vulnerability to a bear market, though it is by no means a perfect predictor. Earnings to the rescue? To be sure, there does seem to be some promising news. According to my data, real S&P Composite stock earnings have grown 1.8% per year, on average, since 1881. From the second quarter of 2016 to the second quarter of 2017, by contrast, real earnings growth was 13.2%, well above the historical annual rate. But this high growth does not reduce the likelihood of a bear market. In fact, peak months before past bear markets also tended to show high real earnings growth: 13.3% per year, on average, for all 13 episodes. Moreover, at the market peak just before the biggest ever stock-market drop, in 1929-32, 12-month real earnings growth stood at 18.3%. Another piece of ostensibly good news is that average stock-price volatility — measured by finding the standard deviation of monthly percentage changes in real stock prices for the preceding year — is an extremely low 1.2%. Between 1872 and 2017, volatility was nearly three times as high, at 3.5%. Low volatility Yet, again, this does not mean that a bear market isn’t approaching. In fact, stock-price volatility was lower than average in the year leading up to the peak month preceding the 13 previous U.S. bear markets, though today’s level is lower than the 3.1% average for those periods. At the peak month for the stock market before the 1929 crash, volatility was only 2.8%. In short, the U.S. stock market today looks a lot like it did at the peaks before most of the country’s 13 previous bear markets. This is not to say that a bear market is guaranteed: Such episodes are difficult to anticipate, and the next one may still be a long way off. And even if a bear market does arrive, for anyone who does not buy at the market’s peak and sell at the trough, losses tend to be less than 20%. But my analysis should serve as a warning against complacency. Investors who allow faulty impressions of history to lead them to assume too much stock-market risk today may be inviting considerable losses. Robert J. Shiller, a 2013 Nobel laureate in economics and professor of economics at Yale University, is co-author, with George Akerlof, of “Phishing for Phools: The Economics of Manipulation and Deception.” Comments are closed.
|
A source of news, research and other information that we consider informative to investors within the context of tail hedging.
The RSS Feed allows you to automatically receive entries
Archives
June 2022
All content © 2011 Lionscrest Advisors Ltd. Images and content cannot be used or reproduced without express written permission. All rights reserved.
Please see important disclosures about this website by clicking here. |
 RSS Feed