|
From Nassim Taleb (New York Times, April 2007): “What we call here a Black Swan (and capitalize it) is an event with the following three attributes. First, it is an outlier, as it lies outside the realm of regular expectations, because nothing in the past can convincingly point to its possibility. Second, it carries an extreme impact. Third, in spite of its outlier status, human nature makes us concoct explanations for its occurrence after the fact, making it explainable and predictable. I stop and summarize the triplet: rarity, extreme impact, and retrospective (though not prospective) predictability.”
Particularly when taking into account current events in Cyprus and Europe, markets are historically extremely complacent by many measures. It is precisely at these times that Black Swans are the most consequential. Financial markets remain in a fragile state and, given the increase in debt and monetary stimulation including zero-bound interest rates, are arguably even more fragile than five years ago during the Panic of 2008. Complacency can change to panic on a dime. From Nicholas Colas of ConvergEx: That little joke could easily describe the state of both cash equities and listed options at the moment. Just look at the last few trading days. You have a Eurozone country – tiny Cyprus, rich with supposedly illicit Russian cash, evidently – threaten to tax depositors as part of a financial system bailout package. Only the most plugged in market observers even had a whiff this was coming just a week ago. It is a monumentally bad idea, if only because the safety of deposits is a cornerstone concept in modern banking. It reminds me of an old Woody Allen line from Love and Death: “If it turns out that there is a God, I don’t think that he’s evil. I think the worst you can say about him is that basically he’s an underachiever.” And yet despite this unexpected and unsound policy step, global markets have not taken the bait into a fresh round of panicky selling, as they have so many times over the past four years. The CBOE VIX Index can’t seem to hold 15, quite a distance from its long run average of 20. Stocks sold off early in the trading day, only to catch a bid at levels above yesterday’s lows. The Dow actually closed up on the day. Yes, it might be that investors will regret not taking the easy out in coming days. The old trading floor aphorism, “Instead of yelling, you should be selling” may yet prove correct. But peel back the volatility “Onion” a few layers, and you’ll find that markets aren’t quite as sleepy as the last few days might indicate. Every month we borrow a page from the options pricing world and look at the changes in Implied Volatility for a host of asset classes and industry sectors. Those measurements are essentially the “VIX of” everything from gold and silver to tech stocks and emerging market equities. By looking at the listed options pricing for a range of Exchange Traded Funds which track these investments, we can watch the ebbs and flows of risk perceptions across disparate asset types and sectors. There are a few graphs immediately after this note, but here is a summary of our findings: Several asset types have followed the CBOE VIX Index higher over the past month. Emerging Markets “VIX” is up 17% over the same period. The Implied Volatility of domestic Small Cap Stocks is up 7%. The “VIX” for developed economy foreign stocks, as measured by the Europe/Asia/Far East (EAFE) index, is likewise 6% higher over the past 30 days. Among industry sectors, the “VIX” for Energy names is up the most (+7%), followed by U.S. Material stocks (+5%) and Consumer Staples, Industrials, and Health Care equity “VIX” (+1-3%). Just as many of the asset types/sectors where we follow monthly changes in Implied Volatility have shown a decline in their “VIX” as those where that measure has increased. The score is 9 down, 9 up, and one essentially unchanged. That is an odd setup, given that 16 of these investment types saw positive returns over the last month. In general, Implied Volatility and returns are supposed to be inversely correlated. This month, not so much… The “Biggest Losers” in terms of Implied Volatility this month were U.S. High Yield Corporate bonds (down 17%), gold/silver (down 11-12%), and then U.S. Consumer Discretionary, Utilities, and Tech stocks (down 6-9%). The only two that broke significantly from the usual Implied Vol/return relationship were the precious metals, with gold essentially unchanged on the month and silver down 3%. The rhyme and reason behind these moves is hard to tease out, so let’s conclude by focusing on the true anomalies – the new lows for the “VIX of” our sample universe. Three assets pop out based on that parameter: High Yield Bonds. The “VIX of” this asset class is stumbling along at/near new lows despite worries about “Junk” bonds as a dangerous parking lot for yield-hungry cash. Historical volatility is clearly the anchor here, with this asset class virtually somnambulant over the past 10/20/30 days. Look deeper into the history of this asset class, however, and you’ll see that it more often trades like equity than it does a reliable payer of coupons. The sleepy Implied Vols here are a clear – and dangerous – anomaly. Gold and Silver: The biggest “Tell” (at least to my eye) that no one is truly worried about Cyprus is the fact that gold and silver haven’t ripped higher. Now maybe we’ve entered a new phase in social history where gold is no longer valued during periods of social duress and questions over fiat currency. I doubt it, however, since it would be the first such event since the advent of writing. About 5,000 years ago. The “VIX of” gold hovers at one year lows, and the historical volatility is pretty dead as well. As of Monday, 10 day volatility was 7% and down from the 30 day volatility of 13%. Silver’s story is much the same. I think the only logical conclusion to the data here, full of oddball inconsistencies, is that we are simply treading water in both stock and equity markets. My bias is to believe that the strength of the tape over the last few days indicates we are going to have a pretty positive close to month. The lack of real interest on the part of the options market to bid up the cost of insurance (Implied Volatility) may not fit neatly into a bullish argument, but this is (for the moment) the hand we’ve been dealt. Shaking the market of its complacency – that sub-15 VIX, for example – isn’t going to be easy. And over the near term, the path to the upside is both easier and increasingly contrarian. And how often do you get that combination? Enjoy it while you can. By Ryan Vlastelica, March 11, 2013
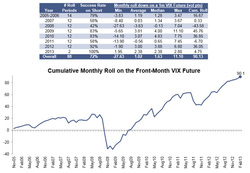
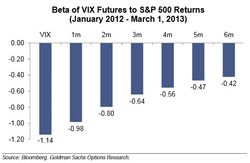
NEW YORK, March 11 (Reuters) - The VIX, Wall Street's favorite measure of investor anxiety, fell on Monday to levels not seen since April 2007, extending a decline that suggests markets will stay calm. The CBOE Volatility Index dropped 7.2 percent to 11.69, reaching a level not seen since April 2007 as U.S. stocks have extended gains, putting the broader S&P 500 less than 1 percent from an all-time closing record high. Some of Monday's move relates to the monthly change in the contracts used to calculate the VIX, so the decline should be read with a bit of caution. The drop was notable as it came on a day when the S&P 500 has been little changed, lately up 0.2 percent. Typically, the VIX has an inverse correlation to equities, falling at a similar rate to a rise in broader indexes. The VIX Index, a 30-day risk forecast of market volatility, is calculated using the midpoints of the bid/ask spread from a strip of near-term S&P 500 index options. "It's very unusual since it is dropping at the same rate that it has on days when the S&P is up three or four points," said Donald Selkin, chief market strategist at National Securities in New York. "That indicates a certain amount of investor complacency, and the lower it goes, the more it seems like there is an upside cap on the market." Equities have been on a tear so far this year. The Dow hit another record intraday high on Monday and has gained 10.2 percent so far in 2013. The gains have come on strong corporate earnings. The stock market's advance over the years has been driven by accommodative monetary policy from the Federal Reserve, despite concerns over U.S. government gridlock and overseas economic weakness. Some of the day's decline can be explained by "a quirk that happens every month in its calculation," said Bill Luby, publisher of the VIX and More blog in San Francisco. As the market approaches the coming expiration of March SPX options on Friday, the calculation of the VIX changes. As of Monday, the VIX is now calculated using prices of April and May SPX options contracts, instead of March and April contracts used last week, according to the CBOE. As stocks have rallied, futures activity shows traders have been building a net short position in VIX futures over the last several months. That means they expect the VIX to continue to decline. According to Friday's data from the Commodity Futures Trading Commission, speculators have a net short position of about 80,000 contracts, less than the high of 110,000 reached in early December. "The move in the VIX could suggest investors anticipate further gains, but the level of 10 is a cap. If it gets that low, we'll very likely have a correction," said Selkin, who helps oversee $3 billion in assets. Action in VIX-related securities was also active. The iPath S&P 500 VIX Short-Term Futures ETN, which tracks short-term futures contracts on the VIX, was down 3.9 percent at $20.78. It has tumbled more than 33 percent so far this year. The exchange-traded note has about $1.08 billion in assets, according to Lipper data, down from $2.10 billion at the end of August 2012. At the same time, volume has accelerated, with the average trading volume swelling from 7.8 million over the past 50 days to 11.1 million over the past 10. An excellent post from Zerohedge (4 March, 2013) - VIX 'Sell-And-Roll' Volume Explodes, Replacing Equity 'Buy-And-Hold' In The New Normal With the heavy central-planning boot of repression on the neck of any and all realized risky asset volatility, it is perhaps no surprise that investors, professional and amateur alike, have been dragged into the latest yield-enhancing 'scheme' of being short front-month vol and earning the premium. Bernanke has created a world of insurance providers - who are fundamentally under-capitalized when the big one hits - as record high levels of net short positions, record volumes, and extreme beta to stocks leave the bevy of option premium sellers still consistently picking up nickels in front of that steam-roller. Of course, as Taleb reminds, suppressing volatility actually makes the world a less predictable and more dangerous place - though for now, it seems, everyone and their eTrade baby is willing to follow Kevin Henry down the vol-premium selling route until of course that steam-roller tears more than just an arm off (given the massive and levered exposure to this market now). Instead of equity 'Buy-and-Hold'; the new normal is 'Sell Vol-and-Roll. Perhaps a re-read of Taleb's Foreign Affairs article is worth while.
February 27, 2013 (IFR) - Hedge funds have levered up their short plays on VIX futures to such extreme levels that the market is poised for a significant short squeeze.
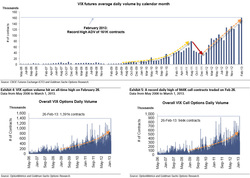
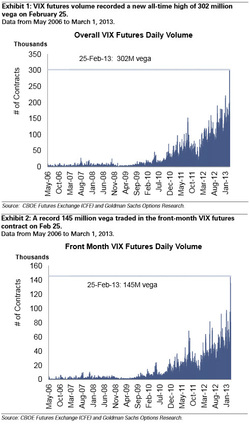
According to the latest available Commitment of Traders data published by the Commodity Futures Trading Commission, the hedge fund community is currently net short the CBOE's Volatility Index (VIX) to the tune of US$85m vega notional via futures contracts. That level is down slightly from US$108m at the end of January. In June, that net exposure was zero - and the swing in exposure means a short squeeze on the VIX is likely if not inevitable. "In search of income, hedge funds have been steadily levering up their positions to short the contango of the VIX futures curve over the past several months," said Ramon Verastegui, head of engineering and strategy for the Americas in the global equity flow group at Societe Generale. [contango essentially means that future prices are higher than current prices; an upward sloping curve whereby levels of short-term volatility are cheaper than intermediate- to long-term levels - this selling/shorting pressure suggests a high level of complacency in the near-term - Ed]. "This short net position is becoming significant, and any market correction can easily lead into a short-squeeze as hedge funds look to get out of their positions." As the VIX shows its first signs of life this year in the face of political risks in the US and Europe, the potential for a reversal of hedge fund positioning to exacerbate any volatility spike resulting from a major event remains a real one. The Italian election was the main driver behind a volatility spike on Monday, but while fears were raised by the event, it didn't prove enough to trigger the short squeeze. After breaking 15 for the first time this year at the end of last week, VIX followed up with a 34% spike on Monday to end the day at 18.99 as a record 302,278 futures contracts changed hands. The index was trading below 16 on Wednesday morning. With the VIX hovering around record lows through the first two months of 2013, generally between 12 and 14, monetizing the contango of the curve has been a no-lose situation in the early part of the year. But strategies that take a long position in longer-dated contracts, while shorting near-term expiries, could prove costly in the event of a volatility spike. And there are plenty of potential triggers on the horizon. "It's been our view that there's been too much complacency for a while now," said Clifford Davis, head of equity derivatives flow sales for the Americas at BNP Paribas. "The market seems to be waking up as we've seen a big uptick in interest for tail hedges over the last week on the S&P 500 and the VIX." A handful of macro risks still remain, and an impending short squeeze via the hedge fund community could compound any subsequent spike. The US government has been scheduled since the start of this year to implement US$85bn in sequestration cuts on March 1 and will run up against the expiration of the debt ceiling later in the month. "We are facing many headwinds. On one side, the equity market has reached new heights in the US. On the other side, from the macro perspective, we still have many potential catalysts such as the sequestration, unresolved Italian elections and potential political spillovers that can realize at anytime," said Verastegui. "As for magnitude, a short-squeeze can create a 'butterfly effect' where a minimum impact can amplify into much higher market volatility spike." The changes involve extending normal futures plays into options on VIX futures. "We've been conditioned by policymakers to believe that market volatility has been contained," said Edward Tom, global head of equity derivatives strategy at Credit Suisse. "The prevalent belief that they will diffuse the impact of foreseeable shocks via kick-the-can-down-the-road policies has kept volatility in check this year," Tom said. "But despite the low vol, skew convexity has increased, opening the door for so-called higher-moment derivatives trades, where an investor would use put options on the VIX to fund a tail hedge against a possible event." Tom and others have been recommending selling put options to purchase call option spread trades on front-month VIX futures contracts as a means of hedging. On Tuesday, options on VIX futures set an all-time volume record, as 1.4m contracts changed hands. |
A source of news, research and other information that we consider informative to investors within the context of tail hedging.
The RSS Feed allows you to automatically receive entries
Archives
June 2022
All content © 2011 Lionscrest Advisors Ltd. Images and content cannot be used or reproduced without express written permission. All rights reserved.
Please see important disclosures about this website by clicking here. |


 RSS Feed