|
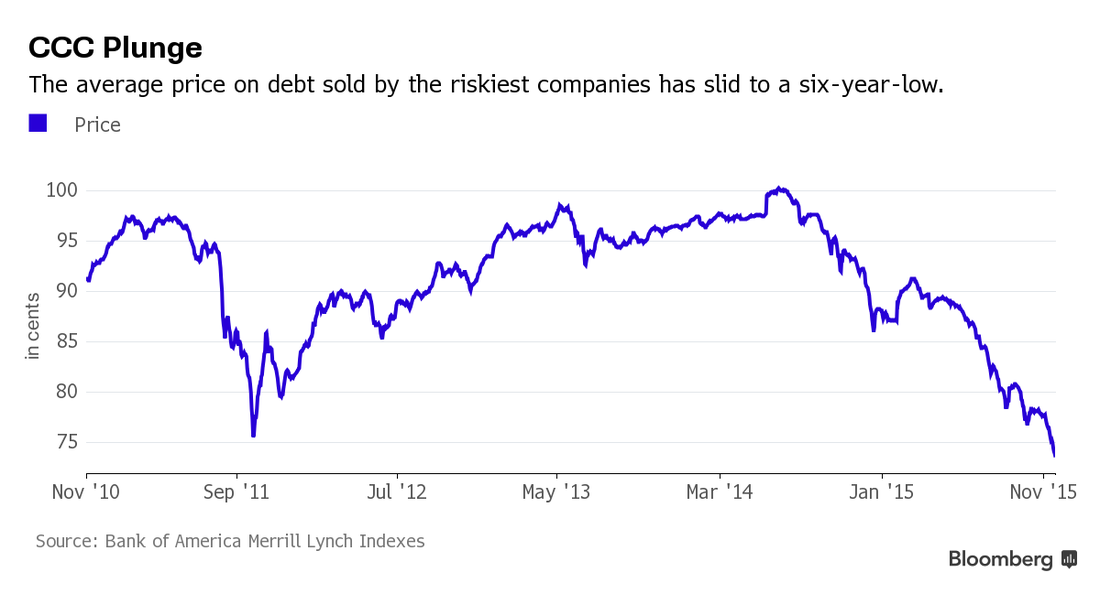
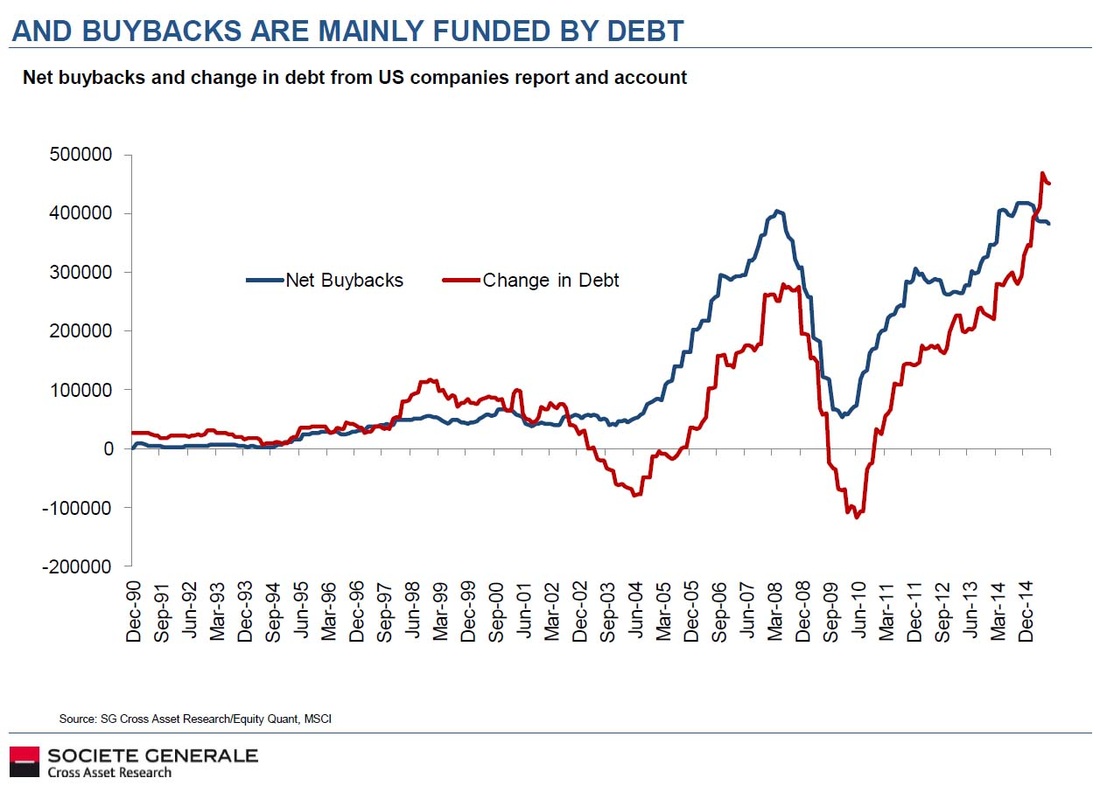
by Sridhar Natarajan and Laura J Keller November 24, 2015 The morning after cancer-center firm 21st Century Oncology Inc. cut its earnings forecast for 2015 last week, money manager Rajay Bagaria woke up to find his holdings of the junk-rated company’s bonds had lost 19 percent of their market value overnight. Investors who own Chesapeake Energy Corp.’s $11.3 billion of bonds watched about a third of their value disappear over the past three weeks. Similar free-falls have appeared on the computer screens of traders in debt of retailer Men’s Wearhouse Inc., gambling-equipment maker Scientific Games Corp. and the owner of New York Sports Club. By one measure tracked by Deutsche Bank AG analysts, the debt of the riskiest companies is selling off at four times the rate of the least-risky junk borrowers -- a ratio that’s typically 1.6 times. Investors in the debt of junk-rated companies are showing little patience for even the slightest whiff of bad news as they seek to shield themselves from the market’s first annual loss since 2008. With the Federal Reserve poised to lift interest rates next month and a deepening commodities slump stirring fears that earnings growth will be squeezed, price swings in the market are intensifying. To Wasserstein & Co.’s Bagaria, it’s creating a combustible environment that’s starting to remind him of the last credit crisis. "It almost feels like 2008 a little bit,” said Bagaria. "When companies underperform, the amount their debt can trade off is much greater than ever before. And then there’s the fear of illiquidity." Small Dominoes Investors are shunning the lowest-rated junk bonds. That is underscored by the extra yield that investors are demanding to hold CCC rated credits relative to those rated BB. This has jumped to the most in six years. With confidence slipping in the strength of the global economy, there are fewer investors to take the opposite side of a trade in the riskiest parts of the market, according to Oleg Melentyev, the head of U.S. credit strategy at Deutsche Bank. "These are all small dominoes in one corner of the market," Melentyev said. "In the early stage, all of this looks random when there is no underlying news to support the big moves. But eventually a narrative emerges -- maybe we have turned the corner on the credit cycle.” Weekly Market Comment November 16, 2015 by John P. Hussman, Ph.D. Investors don’t like to acknowledge bubbles. And because they’ve been so prone to deny them, bubbles (and their consequences) have become a recurring part of the financial landscape over the past two decades. During the late-1990’s technology/dot-com bubble, debt-financed malinvestment was mainly directed toward internet-related companies. The end result was a collapse in the Nasdaq 100 of -83%, while the S&P 500 lost half its value. By the 2002 low, the entire total return of the S&P 500 — in excess of Treasury bills — had been wiped out, all the way to back May 1996. It has taken yet another full-fledged multi-year speculative bubble to get the Nasdaq back to even (most likely only temporarily), and to bring the total return of the S&P 500 since 2000 to even 4% (again, most likely only temporarily). By the completion of the current market cycle, we fully expect that the total return of the S&P 500 since the 2000 peak will fall to zero or negative levels for what will then be a roughly 17-year span, and that the S&P 500 will have underperformed Treasury bills all the way back to roughly 1998; what will then be a nearly 20-year span. As a reminder of how unwilling investors are to acknowledge bubbles, one must remember that in 2000, even before the S&P 500 even reached its final bull market high on a total-return basis, a broad range of dot-com stocks had already collapsed by about 80% from their own 52-week highs. Investors were finally willing to acknowledge that bubble only after it collapsed, but somehow continued to believe that the bubble was contained only to dot-com companies, and continued to push the S&P 500 higher. Consider this gem from the Wall Street Journal, which appeared in July 2000 with the title “What were we THINKING?” “For a while it seemed that risk was dead. Now we know better... Why didn’t they see it coming? Arrogance, greed and optimism plus fear of being left out blinded people to the risks. After all, the dot-commers embraced risk. They prided themselves on their willingness to gamble and used it to justify their lucrative stock-option plans. Unfortunately, at the extreme far end of the risk curve, people lose perspective.” All of that apparent learning, stated in the past tense, might have been well and good were it not for the fact that the S&P 500 was still at record highs, at the most extreme valuation in history, and the broader collapse had not even started. The tech-heavy Nasdaq 100 was down -14% from its March 2000 high, but would go on to lose another -80% by its October 2002 low. Many of those companies were, and remain, outstanding businesses. But just as a parabolic stock price advance is no assurance that the underlying business is sound, having a sound underlying business does little to prevent an overvalued stock from collapsing once investors lose their taste for speculation. Investors have a habit of pointing to past bubbles as if they have actually learned something, even when they are in the midst of another one. By 2007, the S&P 500 had again reached record highs, though the market’s total return from the 2000 peak was still only about 2% annually. The preferred object of speculation during the housing bubble was mortgage debt. With the Federal Reserve suppressing yields to just 1% in 2003, yield-seeking investors found higher returns in mortgage securities, Wall Street jumped to create new “product,” credit standards were lowered, debt was “financially engineered” to bundle it in ways that could get a rubber stamp from ratings agencies, and unsound debt filled the portfolios of insurance companies, banks, and hedge funds. By the March 2009 low, the entire total return of the S&P 500 — in excess of Treasury bill returns — had been wiped out all the way back to June 1995. Investors, analysts, and economists look back on that bubble, and the global collapse that followed, as if they have actually learned something. So here we are, in what in hindsight will likely be called the “QE Bubble” — a moment in history where the most reckless and intentional encouragement of speculation by central bankers actually came to be viewed as not only acceptable but welcome. This is tolerated despite the fact that activist departures of monetary policy from simple rules (such as the Taylor Rule) have absolutely no correlation with subsequent economic activity. This is tolerated despite the clear evidence that yield-seeking speculation was the primary driver of malinvestment that created the housing bubble and economic collapse. We’ve still evidently learned nothing. The preferred object of debt-financed speculation this time around is the equity market. As for direct debt-finance of equity speculation, margin debt soared to more than $500 billion in April, 2.8% of GDP, eclipsing the 2000 and 2007 record highs. One should not compare margin debt to equity market capitalization, but rather to a fundamental; otherwise, the existence of a bubble in prices can make even alarming levels of margin debt appear reasonable. The recent level of stock margin debt is equivalent to 25% of all commercial and industrial loans in the U.S. banking system. Meanwhile, hundreds of billions more in low-quality covenant-lite debt have been issued in recent years. As a ratio of corporate gross value added, both corporate debt and the market value of corporate equities have climbed to the highest levels in history. Our friend Albert Edwards shares another interesting observation: the surge in corporate debt maps closely to the volume of net corporate equity buybacks. The preferred objects of speculation, and the greatest casualties of the 2000 bubble, were technology and dot-com companies. The preferred objects of speculation, and the greatest casualties of the mortgage bubble, were housing and the financial companies that held those mortgages. Recognize that because QE provoked such indiscriminate speculation, the recent extremes in the median price/earnings and price/revenue ratios, across all stocks, actually surpassed their 2000 peaks. Make no mistake: the preferred objects of speculation during the QE bubble have been low-grade debt and the entire stock market, indiscriminate of industry, sector, quality, or capitalization. We are now beginning to observe internal divergences that signal increasing risk aversion among investors. The greatest casualty of the QE bubble will also likely be low-grade debt and the entire stock market, probably just as indiscriminately.
Investors don’t like to acknowledge bubbles. Yet somehow we have little doubt that a few years from now, they will look back at the present moment and ask that tragically perennial question: “What were we THINKING?” |
A source of news, research and other information that we consider informative to investors within the context of tail hedging.
The RSS Feed allows you to automatically receive entries
Archives
June 2022
All content © 2011 Lionscrest Advisors Ltd. Images and content cannot be used or reproduced without express written permission. All rights reserved.
Please see important disclosures about this website by clicking here. |


 RSS Feed