|
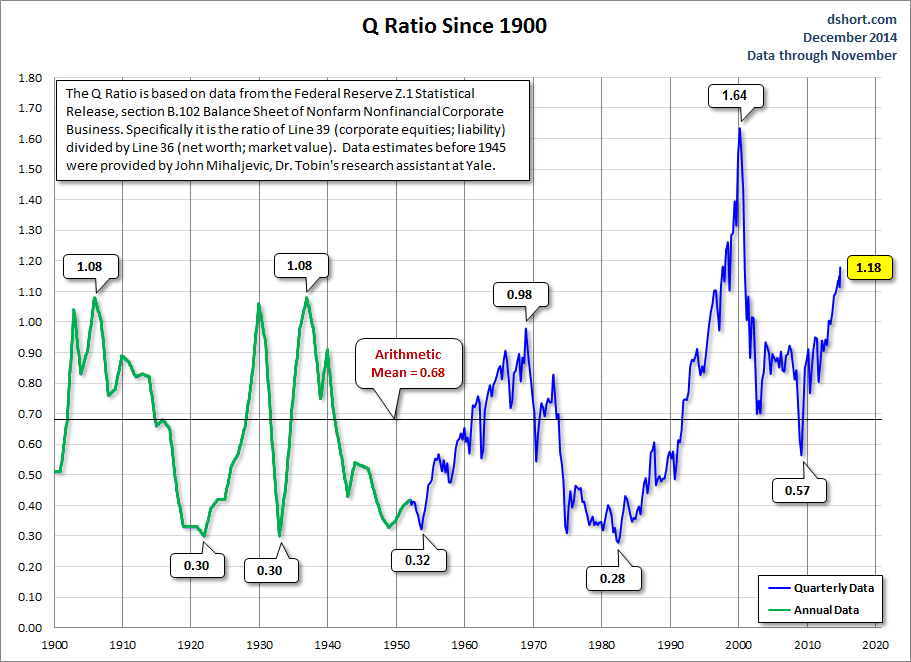
by Doug Short 7 December, 2014 Excerpts: The Q Ratio is a popular method of estimating the fair value of the stock market developed by Nobel Laureate James Tobin. It’s a fairly simple concept, but laborious to calculate. The Q Ratio is the total price of the market divided by the replacement cost of all its companies. Fortunately, the government does the work of accumulating the data for the calculation. The numbers are supplied in the Federal Reserve Z.1 Financial Accounts of the United States of the United States, which is released quarterly. The first chart shows Q Ratio from 1900 to the present. I’ve calculated the ratio since the latest Fed data (through 2014 Q1) based on a subjective process of extrapolating the Z.1 data itself and factoring in the monthly averages of daily closes for the Vanguard Total Market ETF (VTI). Interpreting the Ratio
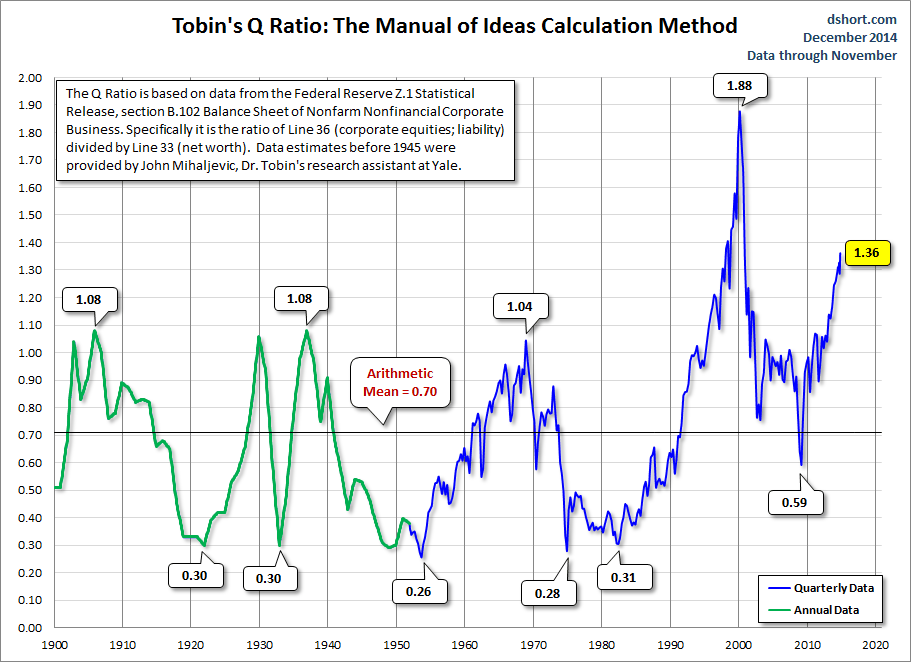
The data since 1945 is a simple calculation using data from the Federal Reserve Z.1 Statistical Release, section B.102, Balance Sheet and Reconciliation Tables for Nonfinancial Corporate Business. Specifically it is the ratio of Line 39 (Market Value) divided by Line 36 (Replacement Cost). It might seem logical that fair value would be a 1:1 ratio. But that has not historically been the case. The explanation, according to Smithers & Co. (more about them later) is that “the replacement cost of company assets is overstated. This is because the long-term real return on corporate equity, according to the published data, is only 4.8%, while the long-term real return to investors is around 6.0%. Over the long-term and in equilibrium, the two must be the same.” ---- The chart below shows the Q-Ratio using a calculation method shared with me a few years ago by John Mihaljevic, formerly Dr. James Tobin’s research associate at Yale. It is based on several values from the Z.1 data and does not factor in intellectual property. The Q Ratio using this method of calculation is 92% above its arithmetic mean and 111% above its geometric mean. Comments are closed.
|
A source of news, research and other information that we consider informative to investors within the context of tail hedging.
The RSS Feed allows you to automatically receive entries
Archives
June 2022
All content © 2011 Lionscrest Advisors Ltd. Images and content cannot be used or reproduced without express written permission. All rights reserved.
Please see important disclosures about this website by clicking here. |


 RSS Feed