|
by John Mauldin Mauldin Economimcs May 22, 2017 The Great Reset We are coming to a period I call the Great Reset. As it hits, we will have to deal, one way or another, with the largest twin bubbles in the history of the world: global debt, especially government debt, and the even larger bubble of government promises. We are talking about debt and unfunded promises to the tune of multiple hundreds of trillions of dollars – vastly larger than global GDP. We are also going to have to restructure our economies and in particular how we approach employment because of the massive technological transformation that is taking place. But let’s keep the focus for now on global debt and government promises. All that debt cannot be repaid under current arrangements, nor can those promises ultimately be kept. There is simply not enough money and not enough growth, and these bubbles are continuing to grow. At some point, we’re going to have to deal with these issues and restructure everything. Now, people have been saying that for years. Remember Ross Perot and his charts in the early 1990s? We’ve all heard the doom and gloom predictions of the demise of civilization that will be brought on by our Social Security and/or healthcare and/or pension problems. And yet, these are real problems we must face. Facing them won’t be the end of the world, but it will mean we must forge a different social contract and make changes to taxes and the economy. That said, the day of reckoning is not here yet. We have time to adjust and prepare. But I believe that within the next 5–10 years we have to confront the ending of the debt and government promises supercycle that has been developing since the late 1930s. This is a global problem, but it will be felt most acutely in the developed world and China. The developing and frontier markets will be radically affected as well, but mostly by fallout from the impacts on the developed world. There has been no instance in history when too much debt didn’t eventually have to be dealt with. The even more massive bubble of government promises will have to be dealt with, too. We need some realistic way to decide how to meet those promises, or at least the portion of them that can be met. For the record, what I mean by government promises are pensions and healthcare benefits in all their myriad varieties. Governments everywhere guaranteed these benefits assuming that taxes would cover their immediate costs and future politicians would figure out the rest. Now the time is rapidly approaching when those “future politicians” are the ones we elect in the here and now. What Happened to Deleveraging? Typically, after a significant recession there is a deleveraging of society. That’s certainly what many expected in 2009. Individuals in some countries did in fact reduce their debts, but not governments and corporations, or most individuals outside the US. That the world is awash in debt is not exactly news. As of 2014, total global debt had risen to $199 trillion, growing some $57 trillion in just the previous seven years, about $8 trillion a year. The McKinsey Institute chart below shows 22 advanced and 25 developing countries that make up the bulk of the world economy. The chart illustrates how the debt is split among household, corporate, government, and financial sectors: 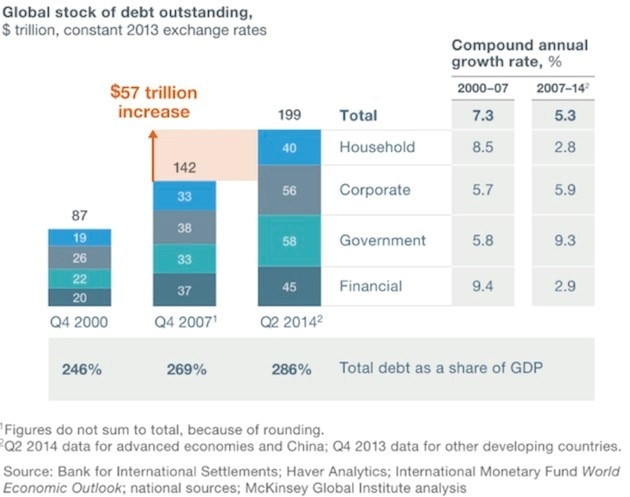 The debt-to-GDP ratio increased in all advanced economies from 2007 through 2014, and the trend is continuing. Here’s a chart for the advanced and developing economies: 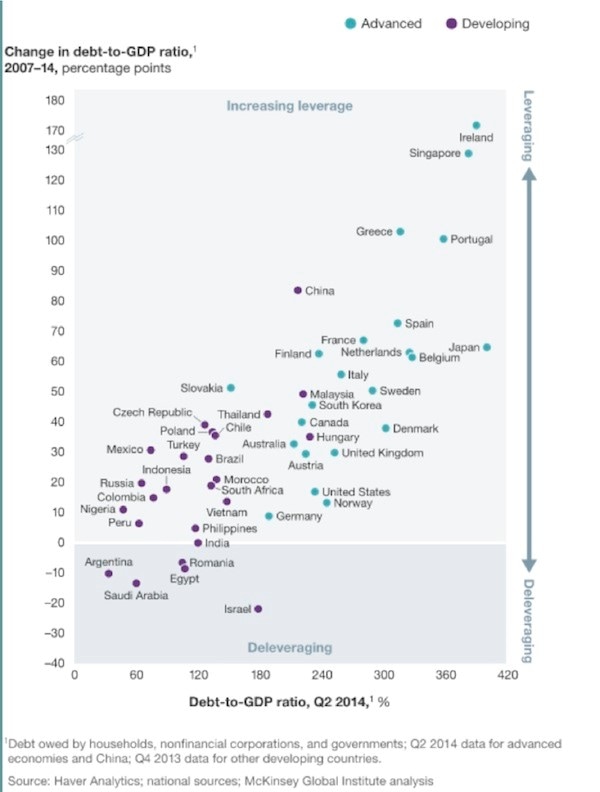 Since that 2014 report was published, global debt rose by $17 trillion through 3Q 2016. In fact, in the first nine months of 2016 global debt rose $11 trillion! After averaging a little over $8 trillion from 2007 through 2014, global debt growth is now accelerating. Global debt-to-GDP is now 325%, though it varies sharply by region and country. More worrisome is that interest rates are slowly rising pretty much everywhere, so debt-servicing costs are rising, too. In the US, according to a note sent to me recently by my friend Terry Savage, Interest on the national debt is the third largest component of our annual Federal budget – after social programs and military spending. In the most recent fiscal year, we paid $240 billion in interest on the national debt. That was a relatively low cost, because the Fed has kept interest rates artificially low for years – as savers can attest. Now, with the Fed hiking rates, interest costs are set to soar. The Congressional Budget Office estimates that every percentage point hike in rates will cost $1.6 trillion over the next ten years! And that’s without adding to the debt itself every year, by running budget deficits. That 1% rate hike will take roughly an additional 3% of our current tax revenues every year. Governments must cover higher interest costs with additional taxes, lower spending, or an increase in the deficit (which means more total debt and even more interest rate cost). Of course, higher interest rates affect more than just government interest rates. Many of us have adjustable-rate mortgages and other loans with floating interest rates. It is not just the US that faces a serious debt problem. Global GDP is roughly $80 trillion. If interest rates were to rise just 1% on our global debt, an additional $2 trillion of that GDP would go to pay that debt increase, or about 1.5% of global GDP. As we have discussed many times, debt is a limiting factor on future growth. Debt is future consumption brought forward. Repaying that debt requires either reduced future consumption or some kind of debt liquidation – those are the only choices. Debt has additional consequences. I have highlighted research from my friends Lacy Hunt and Van Hoisington that correlates increased total debt with slower overall growth. The graph below from Hoisington Investment Management shows total debt as a percentage of GDP for the major developed countries. Note that Japan, with by far the highest debt-to-GDP ratio, is growing slower than Europe, which is growing slower than the US. China’s debt is rapidly overtaking the US’s debt, and at its current growth rate it will soon overtake Europe’s. The grand Chinese debt experiment will eventually reveal the true linkage between the size of debt and growth. Unfunded Liabilities A Citibank report shows that the OECD countries face $78 trillion in unfunded pension liabilities. That is at least 50% more than their total GDP. Pension obligations are growing faster than GDP in most of those countries, if not all. Those are obligations on top of their total debt. By the way, most of those pension obligations are theoretically funded from future returns, which are going to be sparse to nonexistent. That means obligations are compounding significantly faster than the ability to pay them. Without serious adjustments to either benefits or funding, there is literally no hope of catching up. Thought exercise: In European countries where taxes are already more than 50% of GDP, where will they find an extra 5–10% to meet those future pension obligations? How long will younger generations tolerate carrying older generations when the government is taking two thirds of their paychecks? You can begin to see the scope of the problem. Sometime this year, world public and private debt plus unfunded pensions will surpass $300 trillion – not counting the $100 trillion in US government unfunded liabilities. Oops. These obligations simply cannot be paid. A time is coming when the market and voters will realize that these obligations cannot be met. Will voters decide to tax “the rich” more? Will they increase their VAT rates and further slow growth? Will they reduce benefits? No matter what they decide, hard choices will bring political turmoil, which will mean market turmoil. The Unthinkable Recession History shows it is more than likely that the US will have a recession in the next few years, although one doesn’t appear to be on the near horizon. But when it does come, it will likely blow the US government deficit up to $2 trillion a year. Obama took eight years to run up a $10 trillion debt after the 2008 recession. It might take just five years after the next recession to run up the next $10 trillion. Here is a chart my staff created in late 2016 using Congressional Budget Office data, showing what will happen in the next recession if revenues drop by the same percentage as they did in the last recession (without even counting likely higher expenditures this time). And you can add the $1.3 trillion deficit in this chart to the more than $500 billion in off-budget debt, plus higher interest rate expense as interest rates rise. 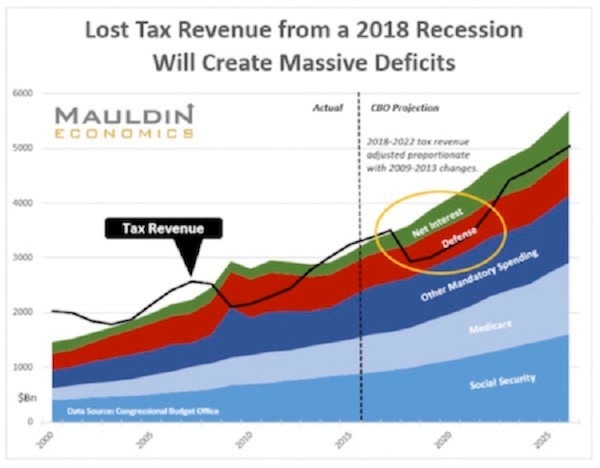 Whether the catalyst is a European recession that spills over into the US, or one triggered by US monetary and fiscal mistakes, or a funding crisis in China, or an emerging-market meltdown, the next recession will be just as global as the last one. And there will be more build-up of debt and more political and economic chaos.
President Trump is a fairly controversial figure, but I think most of us can agree that Trump is going to make volatility great again. The Great Reset will bring an increase in volatility, and the correlation among asset classes will once again approach 1.0, as it did during 2008–2009. If I’m right about the growing debt burden, the recovery from the next recession may be even slower than the last recovery has been – unless the recession is so deep that we have a complete reset of all asset valuations. I don’t believe politicians and central banks will allow that. They will print and try to hold on as long as possible, thwarting any normal recovery, until markets force their hands. But then, I can think of at least three or four ways that politicians and central bankers could react during the Great Reset, and each will bring a different type of volatility and effects on valuations. Flexibility will be critical to successful investing in the future. Comments are closed.
|
A source of news, research and other information that we consider informative to investors within the context of tail hedging.
The RSS Feed allows you to automatically receive entries
Archives
June 2022
All content © 2011 Lionscrest Advisors Ltd. Images and content cannot be used or reproduced without express written permission. All rights reserved.
Please see important disclosures about this website by clicking here. |
 RSS Feed