|
by John Hussman February 15, 2016 Weekly Market Comment Excerpts Given our focus on historically-informed, value-conscious, full-cycle investing, I generally don’t place much attention on short-term technical factors or specific patterns of price action. However, the current setup is one of the few exceptions. In a market return/risk classification that is already the most negative we identify, where a sustained period of speculation has given way increasing risk-aversion, the position of the market relative to very widely identified “support” (about the 1820 level on the S&P 500) is of particular note. Often, well-recognized support levels become places where dip-buyers and swing-traders line up on the buy side, on the assumption that they’ll be rewarded if the market bounces from that support, and that they can quickly cut their losses immediately if the support level is broken. The problem here is that when too many speculators set their stop-loss points at the same level, and valuations are still elevated, there may be neither speculators nor value-conscious investors willing to bid for stock anywhere near those support levels once they break. The resulting gap between eager sellers at a high level and willing buyers at a much lower level is the essential element of market crashes, because every seller requires a buyer. I’ve often observed that market crashes have historically emerged only after a familiar profile of market behavior that features a compressed market retreat of about 14% over 10-12 weeks, a rebound between 1/3 and 2/3 of that decline, a fresh retreat that slightly breaks that initial level of support, a one-day barn-burner advance, and then a collapse as the prior support level is broken. In the 1990’s, I called this pattern the lead-up to “five days of Armageddon” because historically, once rich valuations have been joined with poor market internals (what I used to call “trend uniformity”), the break of a widely-identified support level has often been followed by vertical market losses. The present widely-followed “support” shelf for the S&P 500 is roughly 14% below the 2015 market peak, but most domestic and international indices have already broken corresponding support levels. Given the obscene valuations at the 2015 peak, my impression is that a run-of-the-mill completion of the current market cycle (neither an unusual nor worst-case scenario from a historical perspective) would comprise an additional market decline of roughly 40-50% from present levels. I certainly don’t expect that kind of market loss in one fell swoop. Rather, my immediate concern is that the first leg of this decline could be quite steep. Emphatically, my concern is not simply that the market has retreated by some amount to a widely-identified support level. The issue is the context of rich valuations and poor market internals in which that market weakness has emerged, because when a widely- identified support level gives way at rich valuations, in an environment where poor market internals convey a shift toward risk-aversion among investors, the break can behave as a common trigger for concerted attempts to exit. Though the 1929 and 1987 crashes are the most salient instances, there are numerous less memorable examples across history. As I observed in my June 6, 2002 comment: “I have chosen to call this particular climate a Warning with a capital ‘W’ because every historical market crash of note is found within this one set of conditions. Those conditions are: extremely unfavorable valuations and poor trend uniformity. At present, the market is displaying the same set of characteristics as it did just prior to past market crashes. In both 1929 and 1987, the market crash began about 55 trading sessions after the peak. During those sessions, the market traced out a characteristic pattern of declining peaks and troughs, with a one-day rally just after the third trough (roughly 14% down from the peak), and then ‘five days of Armageddon.’ This is exactly the pattern that the S&P has traced since its late-March peak.” The market followed with a 24% plunge over the following 6 weeks (and an even greater loss on an intra-day basis). It took more than 5 days, but then, the S&P 500 was already down substantially from its 2000 extreme even before that plunge. Prior to the mid-1990’s, the most common “reference” index of investors was the Dow Jones Industrial Average. Presently, the most broadly followed index is the S&P 500 Index. The following charts show the general pattern I’ve described, along with the 1929 and 1987 instances. 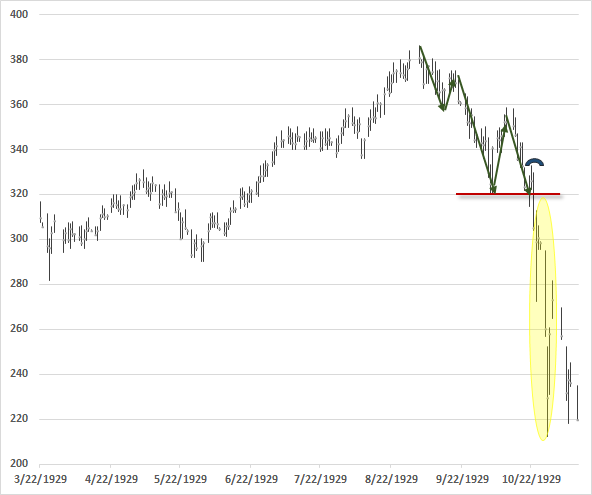 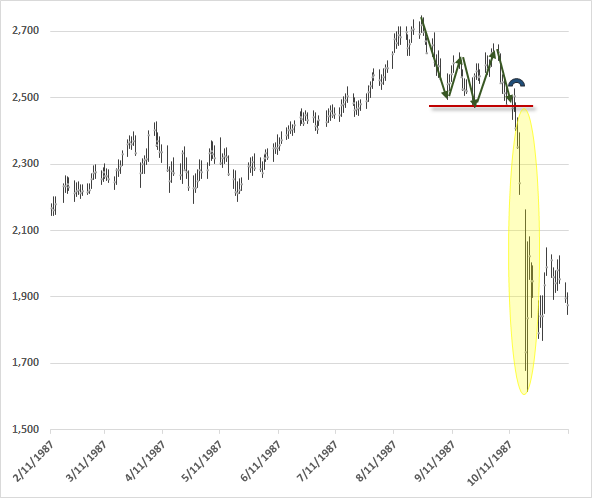 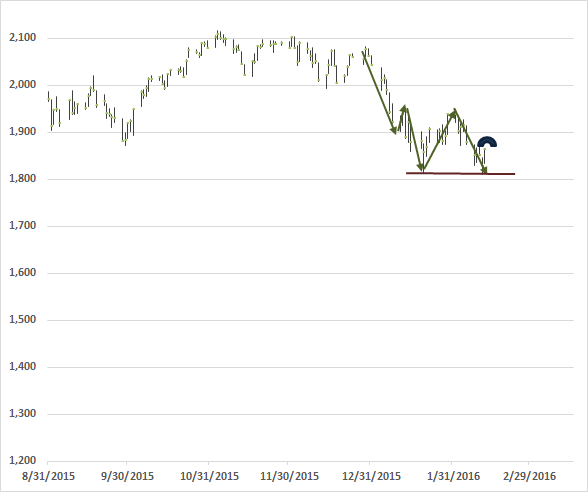 Now, perhaps the rally since Friday is instead a “successful retest” of prior support. Given that leading economic data, coupled with poor market internals, continue to indicate an imminent U.S. recession, I tend to doubt that possibility, but we’ll take the evidence as it arrives. Despite elevated valuations and deteriorating economic conditions in the U.S. and elsewhere, our immediate downside concerns would ease considerably in the event market internals were to clearly improve on our measures. Here and now, investors should ensure that their market exposures and investment horizons would allow them to tolerate a potential 40-50% market loss over the completion of this market cycle without abandoning their discipline.
Meanwhile, remember that investors, in aggregate, cannot exit the stock market, or any other market for that matter. Every security that is issued, including base money created by the Federal Reserve, must be held by some investor, at every point in time, in precisely the form it was issued, until that security is retired. The only question is how eager buyers are, relative to sellers. Prices don’t advance because money goes “into” stocks. Every dollar that a stock buyer brings into the market goes right back out in the hands of a seller. No, prices advance because buyers are more eager than sellers. Prices decline because sellers are more eager than buyers. My concern is that support for an increasingly risk-averse market now rests on the fragile resolve of dip-buying speculators primed to cut-and-run at exactly the same nearby support level, beyond which stands a rather shallow pool of powder-dry, value-conscious potential buyers who remain unwilling to commit that powder anywhere near current levels, in a risk-averse market where further central bank intervention is likely to be futile. Comments are closed.
|
A source of news, research and other information that we consider informative to investors within the context of tail hedging.
The RSS Feed allows you to automatically receive entries
Archives
June 2022
All content © 2011 Lionscrest Advisors Ltd. Images and content cannot be used or reproduced without express written permission. All rights reserved.
Please see important disclosures about this website by clicking here. |
 RSS Feed