|
by John P. Hussman, Ph.D. January 4, 2016 Weekly Market Comment The chart below shows the ratio of nonfinancial market capitalization to corporate gross value added (GVA), along with the ratio of nonfinancial corporate debt to corporate GVA (right scale) which has surged to record-high levels. Understand that MarketCap/GVA is more tightly related to actual subsequent market returns on a 10-12 year horizon than any other measure, including the Fed Model, Price/forward earnings, the Shiller P/E, Tobin’s Q, or any other metric we’ve tested across history. To say that the financial markets are presently at a speculative extreme is an understatement. 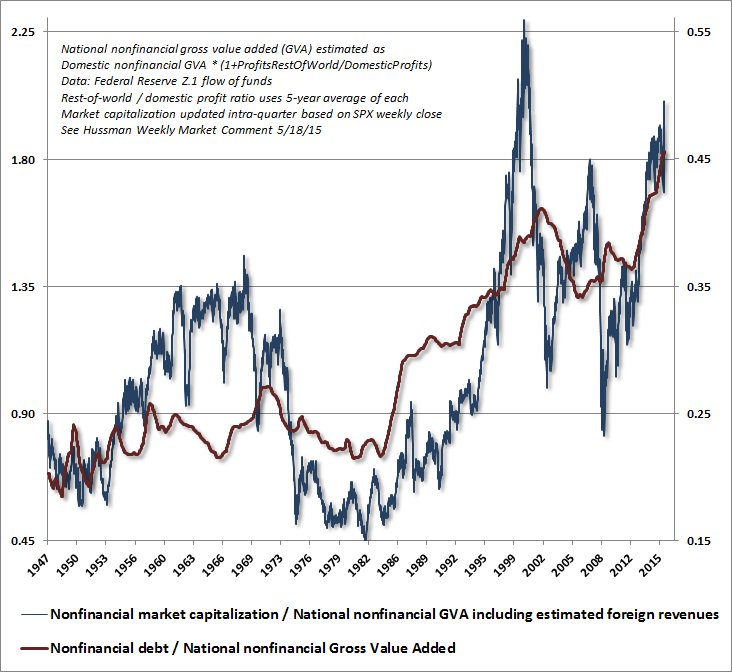
The ratio of nonfinancial market capitalization to corporate gross value added recently peaked at just above 2.0. Now, notice that even over the completion of the two most recent market cycles, when interest rates were quite depressed relative to historical norms, the ratio of MarketCap/GVA fell to just 1.0 or below. That’s certainly not a worst-case scenario (which would be closer to a ratio of 0.45-0.50 as we saw in 1950, 1974, and 1982). Indeed, we’ve never seen a bear market fail to take MarketCap/GVA to about 1.0 or below. For the S&P 500 to lose half of its value over the completion of the current market cycle would merely be a run-of-the-mill outcome given current extremes. A truly worst-case scenario, at least by post-war standards, would be for the S&P 500 to first lose half of its value, and then to lose another 55% from there, for a 78% cumulative loss, which is what would have to occur in order to reach the 0.45 multiple we observed in 1982. We do not expect that sort of outcome. But to rule out a completely pedestrian 40-55% market loss over the completion of the current cycle is to entirely dismiss market history.
Comments are closed.
|
A source of news, research and other information that we consider informative to investors within the context of tail hedging.
The RSS Feed allows you to automatically receive entries
Archives
June 2022
All content © 2011 Lionscrest Advisors Ltd. Images and content cannot be used or reproduced without express written permission. All rights reserved.
Please see important disclosures about this website by clicking here. |
 RSS Feed