|
Weekly Market Comment October 20, 2014 by John P. Hussman, Ph.D. Excerpts: Abrupt market losses typically reflect compressed risk premiums that are then joined by a shift toward increased risk aversion by investors. In market cycles across history, we find that the distinction between an overvalued market that continues to become more overvalued, and an overvalued market is vulnerable to a crash, often comes down to a subtle but measurable shift in the preference or aversion of investors toward risk – a shift that we infer from the quality of market action across a wide range of internals. Valuations give us information about the expected long-term compensation that investors can expect in return for accepting market risk. But what creates an immediate danger of air-pockets, free-falls and crashes is a shift toward risk aversion in an environment where risk premiums are inadequate. One of the best measures of investor risk preferences, in our view, is the uniformity or dispersion of market action across a wide variety of stocks, industries, and security types. Once market internals begin breaking down in the face of prior overvalued, overbought, overbullish conditions, abrupt and severe market losses have often followed in short order. That’s the narrative of the overvalued 1929, 1973, and 1987 market peaks and the plunges that followed; it’s a dynamic that we warned about in real-time in 2000 and 2007; and it’s one that has emerged in recent weeks (see Ingredients of A Market Crash). Until we observe an improvement in market internals, I suspect that the present instance may be resolved in a similar way. As I’ve frequently noted, the worst market return/risk profiles we identify are associated with an early deterioration in market internals following severely overvalued, overbought, overbullish conditions. --- Keep in mind that even terribly hostile market environments do not resolve into uninterrupted declines. Even the 1929 and 1987 crashes began with initial losses of 10-12% that were then punctuated by hard advances that recovered about half of those losses before failing again. The period surrounding the 2000 bubble peak included a series of 10% declines and recoveries. The 2007 top began with a plunge as market internals deteriorated materially (see Market Internals Go Negative) followed by a recovery to a marginal new high in October that failed to restore those internals. One also tends to see increasing day-to-day volatility, and a tendency for large moves to occur in sequence. An interesting feature of the recent air-pocket in stock prices is that many observers characterize the depth of the recent selloff as meaningful. What we’ve seen in recent weeks is very minor in a historical, full-cycle context. The market has not experienced even a single 3% down day in nearly 3 years. The chart below shows the cumulative number of 3% down-days in the Dow Jones Industrial Average over the prior 750 trading sessions, in data over the past century. It’s certainly not an indicator that we would use in isolation, but in given current valuations and the recent deterioration in market internals, we should not be surprised if this absence of large daily losses is short-lived. 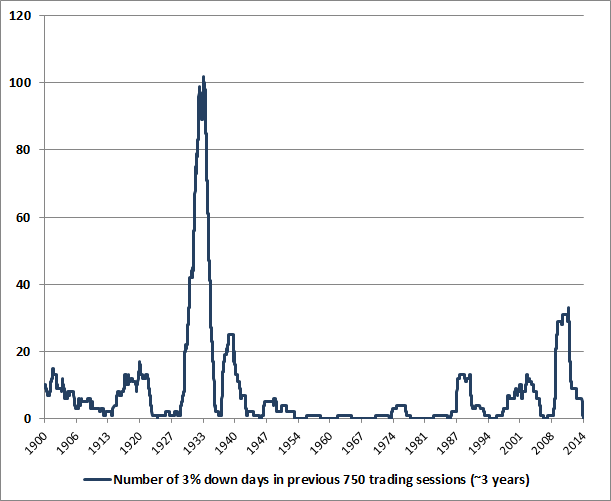
I mention large down-days for a reason. A market crash comprises of a series of one-day losses that may be large, but are not particularly extraordinary in and of themselves. The problem is that they tend to occur in sequence rather than independently. In the chart above, you’ll notice that the cumulative total of 3%+ down days often spikes nearly vertically from zero, meaning that large down days tend to cluster. We may wish to believe that a 25-30% market plunge has zero probability since we know that the probability of a one-day loss of several percent is quite low, making a whole series of them seemingly impossible. But that view overlooks the tendency of large losses to occur in succession. It also overlooks the tendency for monetary easing to support stocks only when low- or zero-interest risk-free assets are considered inferior holdings in comparison to risky ones.
--- In short, recent weeks have seen a strenuously overbought record high in the S&P 500 featuring the most lopsided bullish sentiment (Investor’s Intelligence) since 1987, coupled with increasing divergence and deterioration across a wide range of market internals, including small-capitalization stocks, junk debt, market breadth, and other measures. With compressed risk premiums now joined by indications of increasing risk aversion, we remain concerned that risk premiums will normalize not gradually but in spikes, as is their historical tendency. Comments are closed.
|
A source of news, research and other information that we consider informative to investors within the context of tail hedging.
The RSS Feed allows you to automatically receive entries
Archives
June 2022
All content © 2011 Lionscrest Advisors Ltd. Images and content cannot be used or reproduced without express written permission. All rights reserved.
Please see important disclosures about this website by clicking here. |
 RSS Feed