|
Weekly Market Comment October 27, 2014 by John P. Hussman, Ph.D. My impression is that we are observing a similar dynamic at present. Though we remain open to the potential for market internals to improve convincingly enough to at least defer our immediate concerns about market risk, we should also be mindful of the sequence common to the 1929, 1972, 1987, 2000 and 2007 episodes: 1) an extreme syndrome of overvalued, overbought, overbullish conditions (rich valuations, lopsided bullish sentiment, uncorrected and overextended short-term action); 2) a subtle breakdown in market internals across a broad range of stocks, industries, and security types; 3) an initial “air-pocket” type selloff to an oversold short-term low; 4) a “fast, furious, prone-to-failure” short squeeze to clear the oversold condition; 5) a continued pairing of rich valuations and dispersion in market internals, resulting in a continuation to a crash or a prolonged bear market decline. The panel of charts below shows the Dow Jones Industrial Average in those prior episodes, with the present episode at the lower right. The rounded green arrows identify the bull market peaks in DJIA (or in the 2014 chart, the highest level observed to-date), while the red arrows identify “fast, furious, prone-to-failure” advances that followed the market peak, generally after market internals had already deteriorated. The spikes marked the highest points that the DJIA would see over the remainder of those market cycles, on the way to far deeper bear market lows. The 2000 instance saw an extended period of churning between the January 2000 bull market high in the DJIA and later in the year. The 2000-2002 bear market ultimately asserted itself in earnest once our measures of market internals shifted decidedly negative on September 1, 2000 (see the October 2000 Hussman Investment Research & Insight). In the 2014 chart, the red arrow identifies the rally over the past several sessions. What characterizes the instances below is not simply a decline from a market peak and a subsequent rally, but the sequence from historically extreme overvalued, overbought, overbullish conditions (see Exit Strategy) to a deterioration in market internals, an initial "air pocket" decline, and a subsequent short-squeeze that fails to restore market internals to a favorable condition. Of course, the prior episodes shown below are not themselves indicative of what will occur in the present instance, and current conditions might not be resolved in the same way. Still, investors should interpret recent market strength in its full context: we’ve observed a fast, furious advance to clear an oversold “air-pocket” decline – one that emerged from the pairing of rich valuations with a breakdown in market internals. Having cleared that oversold condition, we remain concerned that the pairing of rich valuations and still-injured market internals may reassert itself. 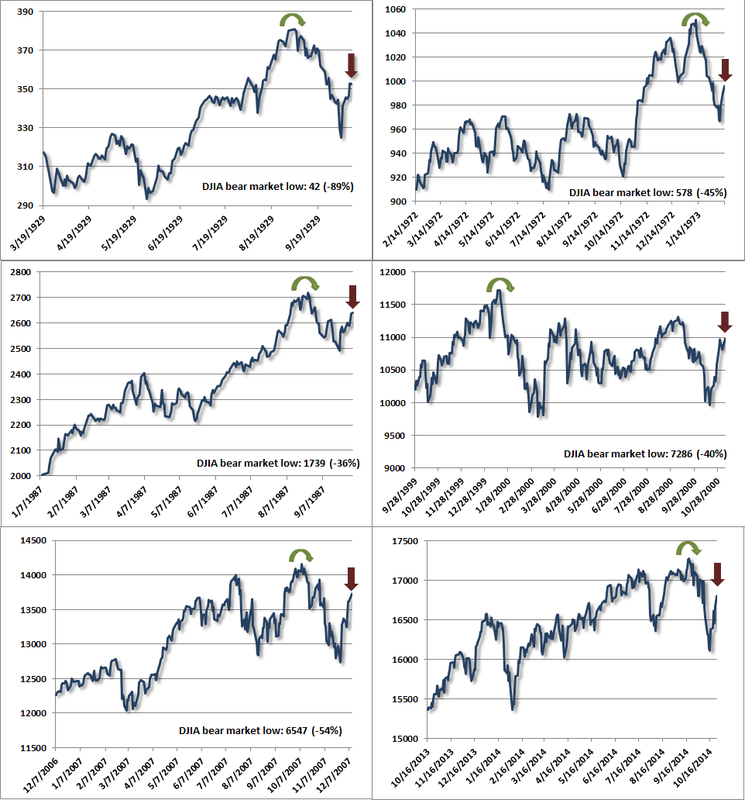
Longer term, we continue to view present market conditions as among the most hostile in history, coupling rich valuations with market internals that remain unfavorable on historically reliable measures. So allow for any sort of action in the near term, but recognize that from a full-cycle perspective, we continue to view a 40-50% market loss as having very reasonable plausibility over the completion of this market cycle.
Comments are closed.
|
A source of news, research and other information that we consider informative to investors within the context of tail hedging.
The RSS Feed allows you to automatically receive entries
Archives
June 2022
All content © 2011 Lionscrest Advisors Ltd. Images and content cannot be used or reproduced without express written permission. All rights reserved.
Please see important disclosures about this website by clicking here. |
 RSS Feed