Black Swans
Nassim Taleb (New York Times, April 2007):
"What we call here a Black Swan (and capitalize it) is an event with the following three attributes. First, it is an outlier, as it lies outside the realm of regular expectations, because nothing in the past can convincingly point to its possibility. Second, it carries an extreme impact. Third, in spite of its outlier status, human nature makes us concoct explanations for its occurrence after the fact, making it explainable and predictable. I stop and summarize the triplet: rarity, extreme impact, and retrospective (though not prospective) predictability.
"What we call here a Black Swan (and capitalize it) is an event with the following three attributes. First, it is an outlier, as it lies outside the realm of regular expectations, because nothing in the past can convincingly point to its possibility. Second, it carries an extreme impact. Third, in spite of its outlier status, human nature makes us concoct explanations for its occurrence after the fact, making it explainable and predictable. I stop and summarize the triplet: rarity, extreme impact, and retrospective (though not prospective) predictability.
What is Tail Risk?
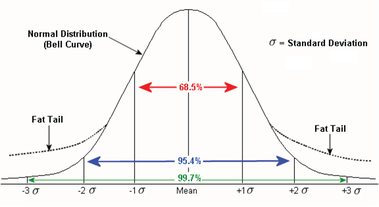
“Tails” refer to the two ends of a probability distribution with “left tail” events describing the most negative outcomes — such as severe, widespread market shocks which generate large losses— and “right tail” events describing the most positive market outcomes. “Tail risk” refers to the prospect of left-tail events, which is seen in the left tail of the probability distribution. Tail events are rare, though more common than would be reflected in a normal distribution (Gaussian) bell curve. In fact, it turns out tails are “fatter”, that is, more frequent than many people realize.
|
This first chart is a diagram of a normal probability distribution. The horizontal X-axis shows the investment returns (from the lowest on the left to the highest on the right and with the mean return in the middle). The vertical Y-axis show the number of observations of each return (for instance, the number of months that produce a +5% gain, the number of months that produce a -5% loss, and so on).
|
In a normal distribution, the largest number of observations centres around the mean and declines to the right and left, giving it the bell shape as there are typically fewer observations of extreme returns. Units of standard deviation (‘”sigma”, noted by the symbol δ in the diagram) provide a measurement of the expected frequency of the returns. In a normal distribution, returns that are generated within one sigma of the mean are predicted to happen 68.5% (roughly two-thirds) of the time. As noted above, fat tails exist because extreme events are far more prevalent than is explained by the normal distribution.
|
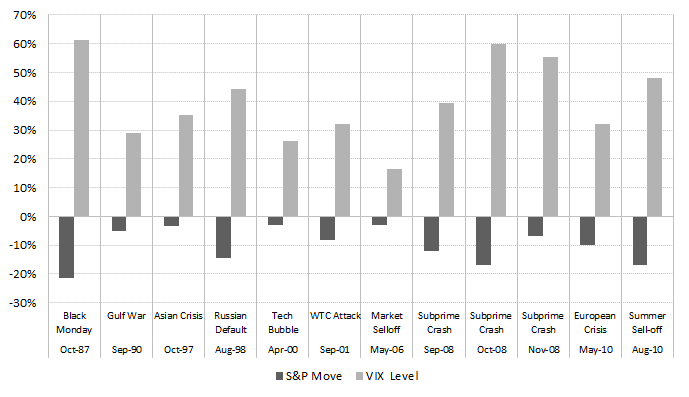
These fat tails can be empirically verified (see table on left using data going back 50 years). What is readily apparent from these analyses is that not only are tail events far more frequent than is generally believed and financial theory predicts, but they are also far greater in magnitude and thus more consequential. The 2008 global financial collapse, a crisis that was completely unexpected by most and had devastating consequences, illuminated very powerfully the reality and seriousness of tail risk.
Before the crisis, few people were emphasizing the significance of tail risk for markets and investors; and fewer still were as vocal as Nassim Taleb, the premier specialist on rare events. Taleb described these risks as “Black Swans”. |
How often do Black Swans occur?
|
In finance, these consequential Black Swan events happen more often than one might expect; the 1987 stock market crash, the 1990 US and Japanese real estate collapse, the 1998 Russian default and LTCM collapse, the collapse of the 2000 tech market bubble, the collapse of the 2007 real estate bubble, the 2008 stock market crash, the 2010-2011 European, and US debt crisis are all examples of crises that were “obvious” in hindsight but surprising nonetheless during their occurrence.
|
Why is it important to manage tail risk?
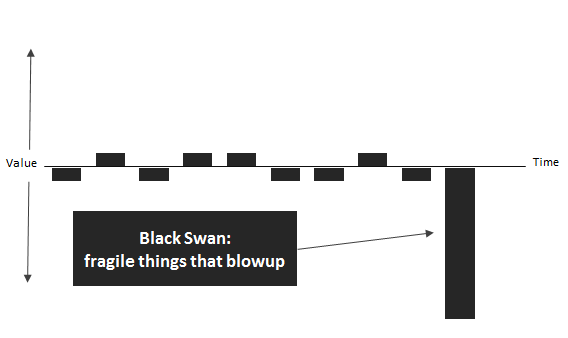
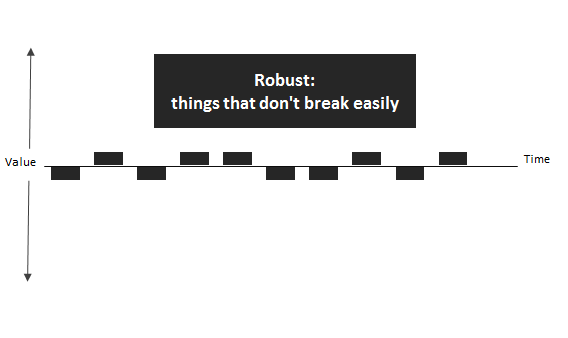
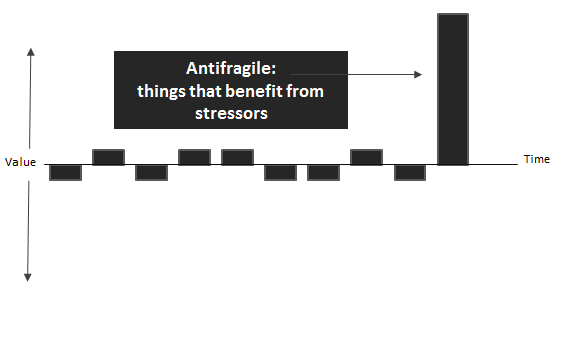
The events of 2008 are now widely understood to have been a Black Swan event. Protecting against these catastrophic events is both necessary and possible. The series of charts above depict investment profiles with differing degrees of exposure to risks and returns. A “Black Swan” profile describes a high risk of losing everything ("blowing up") - think banking industry in 2008-2009. A “Robust” profile means safety - think investment in cash. An “Antrifragile” profile is one that benefits from increased volatility - think tail-hedged portfolios.
How is protecting against ‘Black Swans’ different than managing volatility?
Overall volatility (returns within +/- 1 standard deviation) can often be reduced using traditional diversification techniques (diversification by asset class, geography, industry, cap size, currency, duration etc.). Black Swans, however, behave differently. The speed and severity of unexpected market declines – like the world witnessed in 2008 – are exacerbated by the interconnectedness of global financial markets and economies. As a result, correlations amongst asset classes can quickly rise to 1.0, often rendering these diversification techniques virtually useless.
Most investors have had to rely on imprecise and often ineffective hedges. These types of defensive strategies (in addition to the use of simple diversification) are widely available and commonly used by investors:
There are pros and cons associated with each of these strategies, but none provides reliable defence against Black Swans. The protection benefit of the first three strategies results from a correct prediction of the market’s downward direction. If the prediction is incorrect, however, and the market moves up, either losses mount (due to the short exposure), or the benefits of a rising market are missed (cash and defensive stocks). A similar risk applies to being outright long volatility via VIX ETFs. These are market timing risks.
With respect to swaps, there is a cost to bear for purchasing the protection. If the market rises, gains are net of this cost. But in a true panic - as we experienced during the second part of 2008 - the counterparty to the swap may no longer be able to payout gains, effectively wiping out the usefulness of the swap. This is not an insignificant risk; one need only remember Lehman and AIG. Gold, although a very popular hedge, is not at all effective as tail protection. Typically, in a crisis event, investors are desperate to raise cash to cover their losses and margin calls and thus sell anything liquid and profitable. In 2008, gold dropped by some 30%.
Most investors have had to rely on imprecise and often ineffective hedges. These types of defensive strategies (in addition to the use of simple diversification) are widely available and commonly used by investors:
- Raising cash
- Moving into defensive stocks
- Reducing market exposure through short exposure (e.g. short S&P500 ETF)
- Long volatility (e.g. VIX ETFs)
- Investing in some sort of defensive swap (e.g. CDS, Total-Return Swaps)
- Investing in gold
There are pros and cons associated with each of these strategies, but none provides reliable defence against Black Swans. The protection benefit of the first three strategies results from a correct prediction of the market’s downward direction. If the prediction is incorrect, however, and the market moves up, either losses mount (due to the short exposure), or the benefits of a rising market are missed (cash and defensive stocks). A similar risk applies to being outright long volatility via VIX ETFs. These are market timing risks.
With respect to swaps, there is a cost to bear for purchasing the protection. If the market rises, gains are net of this cost. But in a true panic - as we experienced during the second part of 2008 - the counterparty to the swap may no longer be able to payout gains, effectively wiping out the usefulness of the swap. This is not an insignificant risk; one need only remember Lehman and AIG. Gold, although a very popular hedge, is not at all effective as tail protection. Typically, in a crisis event, investors are desperate to raise cash to cover their losses and margin calls and thus sell anything liquid and profitable. In 2008, gold dropped by some 30%.
How does one protect against Black Swans?
There are few methods as effective as a dedicated options strategy, particularly through the use of puts. However, there are limitations to employing this strategy successfully:
- Long option strategies where premiums are paid can be very expensive, especially if maintained over an extended period of time;
- The unexpected nature of Black Swans requires that protection strategies never be allowed to lapse. An active, “always on” option strategy requires effort, diligence and expertise;
- Option market bid-offer pricing for deep out-of-the-money (OTM) puts is extremely wide, typically about 500%. Being able to trade at favourable prices can mean the difference between being able to efficiently implement the strategy or being completely priced out.
- True options expertise and experience is difficult to access.
